WHAT IS CONTOUR MAP?
WHAT IS CONTOUR MAP?కాంటూర్ మ్యాప్ అంటే ఏమిటి? – పూర్తి వివరాలు
WHAT IS CONTOUR MAP? What is contour map example?
భూమి ఉపరితలంపై ఉన్న ఎత్తు–తగ్గుదలలను స్పష్టంగా చూపించడానికి ఉపయోగించే ప్రత్యేక మ్యాప్ను కాంటూర్ మ్యాప్ (Contour Map) లేదా సమోన్నతి రేఖా పటం అంటారు.WHAT IS CONTOUR MAP? What is contour map example?
భూగోళ శాస్త్రం, సర్వేయింగ్, సివిల్ ఇంజినీరింగ్, వ్యవసాయం, పట్టణ ప్రణాళిక మరియు పర్యాటక రంగాలలో కాంటూర్ మ్యాప్స్కు ఎంతో ప్రాధాన్యం ఉంది.
సాధారణ మ్యాప్లు ప్రాంతాల స్థానాలను చూపిస్తే, కాంటూర్ మ్యాప్లు భూమి ఆకృతి, కొండలు, లోయలు, వాలుదనం మరియు ఎత్తును తెలియజేస్తాయి.
కాంటూర్ మ్యాప్ అంటే ఏమిటి?WHAT IS CONTOUR MAP?
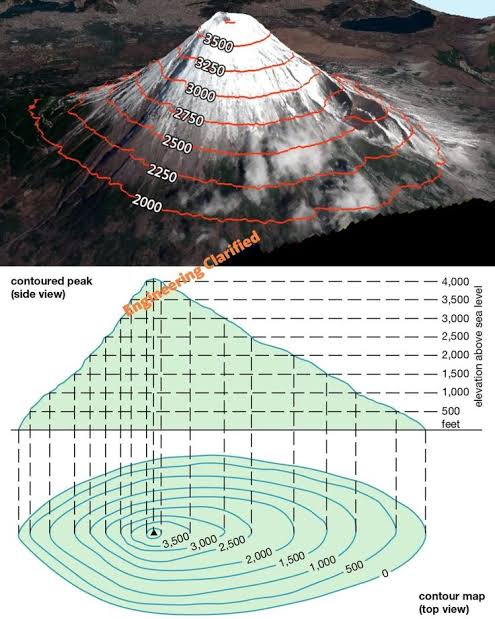
కాంటూర్ మ్యాప్ అనేది భూమిపై ఒకే ఎత్తులో ఉన్న బిందువులను కలిపే కాంటూర్ రేఖలు (Contour Lines) ద్వారా రూపొందించిన మ్యాప్.
ప్రతి కాంటూర్ రేఖ సముద్ర మట్టానికి (Mean Sea Level) సంబంధించి ఒక నిర్దిష్ట ఎత్తును సూచిస్తుంది. ఒకే రేఖపై ఉన్న అన్ని బిందువులు ఒకే ఎత్తులో ఉంటాయి.
కాంటూర్ రేఖల లక్షణాలు
1. ఒకే ఎత్తును సూచిస్తాయి
ఒక కాంటూర్ రేఖపై ఉన్న ప్రతి బిందువు సమాన ఎత్తులో ఉంటుంది.
2. కాంటూర్ రేఖలు ఒకదానిని మరొకటి ఖండించవు
సాధారణ పరిస్థితుల్లో రెండు కాంటూర్ రేఖలు కలవవు లేదా ఒకదానిని మరొకటి దాటవు.
3. మూసివున్న ఆకారాలను ఏర్పరుస్తాయి
కాంటూర్ రేఖలు సాధారణంగా వృత్తాకార లేదా మూసివున్న ఆకారంలో ఉంటాయి.
4. వాలుదనాన్ని సూచిస్తాయి
- రేఖలు దగ్గరగా ఉంటే – భూమి వాలుదనం ఎక్కువ (Steep Slope)
- రేఖలు దూరంగా ఉంటే – భూమి వాలుదనం తక్కువ (Gentle Slope)
కాంటూర్ ఇంటర్వల్ అంటే ఏమిటి?
రెండు వరుస కాంటూర్ రేఖల మధ్య ఉన్న ఎత్తు వ్యత్యాసాన్ని కాంటూర్ ఇంటర్వల్ (Contour Interval) అంటారు.
ఉదాహరణకు:
- ఒక రేఖ 100 మీటర్లు
- తదుపరి రేఖ 110 మీటర్లు
అయితే కాంటూర్ ఇంటర్వల్ = 10 మీటర్లు
మ్యాప్ మొత్తం మీద ఈ ఇంటర్వల్ ఒకే విధంగా ఉంటుంది.
కాంటూర్ మ్యాప్లో కనిపించే భూభాగ ఆకృతులు
కొండ (Hill)
కేంద్రం వైపు ఎత్తు పెరుగుతూ ఉండే మూసివున్న కాంటూర్ రేఖలు కొండను సూచిస్తాయి.
లోయ (Valley)
V ఆకారంలో కనిపించే కాంటూర్ రేఖలు లోయను సూచిస్తాయి.
గుట్ట (Ridge)
పొడవుగా ఉన్న ఎత్తైన భూభాగాన్ని రిడ్జ్ అంటారు.
గుంత లేదా పల్లం (Depression)
లోపలి భాగంలో ఎత్తు తగ్గుతూ ఉండే ప్రాంతాన్ని సూచిస్తుంది.
కాంటూర్ మ్యాప్ ఉపయోగాలు WHAT IS CONTOUR MAP? What is contour map example?
1. సర్వేయింగ్లో
భూమి ఆకృతిని తెలుసుకోవడానికి సర్వేయర్లు కాంటూర్ మ్యాప్లను ఉపయోగిస్తారు.
2. సివిల్ ఇంజినీరింగ్లో
- రోడ్లు
- వంతెనలు
- ఆనకట్టలు
- కాలువలు
నిర్మాణానికి అనువైన ప్రాంతాలను గుర్తించడంలో ఉపయోగపడుతుంది.
3. వ్యవసాయంలో
- నీటి పారుదల ప్రణాళిక
- నేల సంరక్షణ
- భూసార నిర్వహణ
కోసం ఉపయోగిస్తారు.
4. పట్టణ ప్రణాళికలో
కొత్త కాలనీలు, పారిశ్రామిక ప్రాంతాలు మరియు రవాణా మార్గాల ప్రణాళికలో సహాయపడుతుంది.
5. పర్యాటక మరియు ట్రెక్కింగ్లో
కొండ ప్రాంతాలలో ప్రయాణించే వారికి మార్గదర్శకంగా పనిచేస్తుంది.
కాంటూర్ మ్యాప్ను ఎలా చదవాలి?
రేఖల మధ్య దూరం చూడండి
- దగ్గరగా ఉంటే – ఎత్తైన వాలు
- దూరంగా ఉంటే – సమతల ప్రాంతం
ఎత్తు విలువలను పరిశీలించండి
ప్రతి రేఖపై ఉన్న సంఖ్య ఆ ప్రాంత ఎత్తును తెలియజేస్తుంది.
మూసివున్న రేఖలను గుర్తించండి
- ఎత్తు పెరిగితే కొండ
- ఎత్తు తగ్గితే పల్లం
కాంటూర్ మ్యాప్ ప్రయోజనాలు
✅ భూమి ఆకృతిని స్పష్టంగా చూపిస్తుంది
✅ నిర్మాణ ప్రాజెక్టుల ప్రణాళికకు ఉపయోగపడుతుంది
✅ వరదలు మరియు నీటి ప్రవాహాన్ని అంచనా వేయవచ్చు
✅ వ్యవసాయ అభివృద్ధికి సహాయపడుతుంది
✅ పర్యావరణ అధ్యయనాలకు ఉపయోగపడుతుంది
కాంటూర్ మ్యాప్ పరిమితులు
❌ సాధారణ వ్యక్తులకు అర్థం చేసుకోవడం కొంత కష్టం
❌ పెద్ద ప్రాంతాల కోసం ఖచ్చితమైన సర్వే అవసరం
❌ నవీకరించడానికి సమయం మరియు ఖర్చు ఎక్కువ
ముగింపు
కాంటూర్ మ్యాప్ (Contour Map) WHAT IS CONTOUR MAP?అనేది భూమి ఎత్తు–తగ్గుదలలను కాంటూర్ రేఖల ద్వారా చూపించే ముఖ్యమైన పటం. భూగోళ శాస్త్రం, సర్వేయింగ్, సివిల్ ఇంజినీరింగ్, వ్యవసాయం మరియు పట్టణ ప్రణాళిక వంటి అనేక రంగాలలో ఇది కీలక పాత్ర పోషిస్తుంది. కాంటూర్ మ్యాప్లను అర్థం చేసుకోవడం ద్వారా భూమి ఆకృతిని సులభంగా విశ్లేషించి సరైన నిర్ణయాలు తీసుకోవచ్చు.
. ENGLISH VERSION ;-
What Is a Contour Map? – Complete Guide
Introduction
A Contour Map is a specialized map used to represent the shape, elevation, and relief of the Earth’s surface. Unlike ordinary maps that show locations and boundaries, contour maps illustrate the height and slope of the land using contour lines.
Contour maps are widely used in geography, surveying, civil engineering, agriculture, urban planning, environmental studies, and outdoor activities such as hiking and trekking.
What Is a Contour Map?
A contour map is a map that uses contour lines to connect points of equal elevation above mean sea level. These lines help visualize the three-dimensional shape of the terrain on a two-dimensional map.
Each contour line represents a specific elevation, and all points along that line have the same height above sea level.
What Are Contour Lines?
Contour lines are imaginary lines drawn on a map that connect points having the same elevation.
For example, if a contour line is marked as 100 meters, every point along that line is exactly 100 meters above sea level.
These lines help users understand the terrain without physically visiting the location.
Characteristics of Contour Lines
1. Equal Elevation
Every point on a contour line has the same elevation.
2. Contour Lines Never Cross
Under normal circumstances, contour lines do not intersect or cross each other because one point cannot have two different elevations.
3. Closed Shapes
Contour lines usually form closed loops, even if the complete loop is not visible on the map.
4. Indicate Slope
- Closely spaced contour lines indicate a steep slope.
- Widely spaced contour lines indicate a gentle or flat slope.
What Is Contour Interval?
The Contour Interval is the vertical difference in elevation between two consecutive contour lines.
Example:
- First contour line: 100 meters
- Next contour line: 110 meters
Contour Interval = 10 meters
The contour interval remains constant throughout a map.
Landforms Represented by Contour Maps
Hill
A hill is shown by closed contour lines with increasing elevation toward the center.
Valley
Valleys are represented by V-shaped contour lines pointing toward higher ground.
Ridge
A ridge appears as an elongated area of high ground extending across the landscape.
Depression
A depression or basin is shown by closed contour lines where elevation decreases toward the center.
How to Read a Contour Map
Check the Elevation Values
The numbers written on contour lines indicate the height of the land above sea level.
Observe the Distance Between Lines
- Lines close together = Steep terrain
- Lines far apart = Gentle slope or flat terrain
Identify Landforms
Closed loops, V-shapes, and other contour patterns help identify hills, valleys, ridges, and depressions.
Uses of Contour Maps
1. Surveying
Surveyors use contour maps to understand land elevations and terrain features.
2. Civil Engineering
Contour maps are essential for planning and designing:
- Roads
- Bridges
- Dams
- Canals
- Buildings
3. Agriculture
Farmers and agricultural planners use contour maps for:
- Irrigation planning
- Soil conservation
- Water management
4. Urban Planning
Contour maps help determine suitable locations for residential, commercial, and industrial development.
5. Environmental Studies
Scientists use contour maps to analyze watersheds, drainage systems, and environmental changes.
6. Hiking and Trekking
Outdoor enthusiasts use contour maps to understand terrain difficulty and select suitable routes.
Advantages of Contour Maps
- Clearly represent the shape of the land surface.
- Help identify hills, valleys, slopes, and depressions.
- Useful for engineering and construction projects.
- Support water resource management and flood planning.
- Aid in agricultural and environmental studies.
- Provide accurate topographic information.
Limitations of Contour Maps
- Can be difficult for beginners to interpret.
- Require accurate surveying and data collection.
- Preparation and updates can be time-consuming and costly.
- Small terrain details may not always be visible depending on the contour interval.
Importance of Contour Maps
Contour maps play a crucial role in understanding the Earth’s surface. They provide valuable information about elevation, slope, and landforms, helping professionals make informed decisions in construction, agriculture, transportation, and environmental management.
Without contour maps, planning large-scale infrastructure projects and analyzing terrain characteristics would be significantly more challenging.
Conclusion
A Contour Map is an essential tool used to represent the elevation and shape of the Earth’s surface through contour lines. By showing areas of equal height, contour maps make it easier to visualize terrain features such as hills, valleys, ridges, and slopes. Their applications span numerous fields, including surveying, engineering, agriculture, urban planning, and environmental studies, making them one of the most important types of topographic maps.
.